
Section navigation is enabled for this long article; the full text remains continuous.
The BSTVC Spatiotemporal Interpretability Research Initiative has launched its official website, bringing its statistical framework, research applications, software, and learning resources together in one public home. For researchers working with observations across places and periods, the site offers a practical route from a scientific question to an analysis they can inspect, explain, and reproduce.
At its center is a question that a single average relationship can leave unanswered: where does an association change, when does it change, and by how much? BSTVC, short for Bayesian Spatiotemporally Varying Coefficients, addresses those questions through models that make variation across space and time explicit, while retaining uncertainty in the estimates.

Figure 1. The official BSTVC website introduces local interpretation, global contribution, and dynamic prediction. Live website capture, 5 October 2026.
A shared home for the research initiative
The new site connects the work of the West China Health & Medical Geography Group, a research group within the HEOA think tank, with the wider BSTVC software family. Chao Song, the group's principal investigator and developer of BSTVC theories and products, leads its methodological and scientific direction. The team page also recognizes Xianteng Tang's work in software and Desktop engineering.
Visitors can move between methods, applications, publications, team information, and downloads. That structure matters for an international research audience: a visitor encountering BSTVC for the first time can follow the connection between a modeling idea, its published applications, and the tools available to use it.
The launch establishes a public home for the research initiative and its resources. It also makes the relationship between the organization, the methodological framework, and individual software products easier to navigate.
Where, when, and how much
The website organizes spatiotemporal interpretability around three connected tasks. Local interpretation examines how the direction and magnitude of a modeled association vary across locations or periods. Spatial and temporal coefficients, read alongside Bayesian credible intervals, help researchers investigate patterns that an overall coefficient may obscure.
Global contribution provides a complementary view. The Spatiotemporal Variance Partitioning Index, or STVPI, summarizes model-based contributions to spatial, temporal, and combined variation. Dynamic prediction extends the workflow to estimated outcomes, including smoothing, missing-value imputation, and forecasting under an appropriate model.
These tasks share a Bayesian full-map approach: local estimates are fitted together within a structured model of the study domain. Interpretation therefore remains connected to model specification and posterior uncertainty. Conditional associations and contribution estimates do not, by themselves, establish causal effects; forecasting claims also require suitable validation.

Figure 2. The local-interpretation exhibit makes variation in a coefficient visible. Its interactive values are synthetic teaching examples, not empirical findings. Live website capture, 5 October 2026.
From the website to a working analysis
BSTVC Desktop is the recommended starting point for a guided local workflow. The English release supports Windows 10/11 on x64 computers and includes continuous, binary, and count outcome workflows. Standard model fitting uses a graphical interface without requiring an R script; R remains available for customized visualization and programmable analysis.
The workflow begins with importing a table and its map, checking spatial identifiers and observation order, and choosing model settings. Researchers then fit the model, inspect its evaluation measures, and export results. Those preparation steps are substantive: a completed computation cannot compensate for observations assigned to the wrong map units.
Desktop is available free for academic and other permitted noncommercial use under the repository's PolyForm Noncommercial License 1.0.0. Researchers should review the license and release requirements before adopting it.
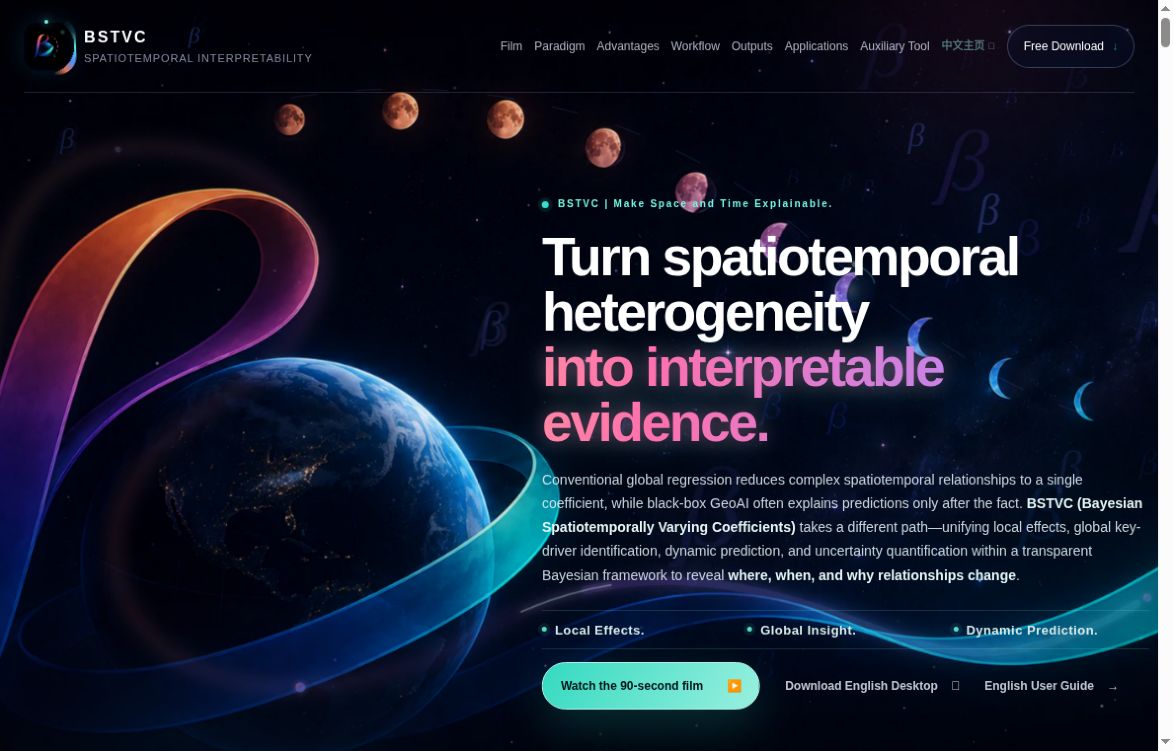
Figure 3. The English Desktop website connects the framework to software, documentation, and downloads. Live website capture, 5 October 2026.
Learn through documented research cases
The English user guide provides complete walkthroughs for three response types: global healthy life expectancy for continuous outcomes, COVID-19 occurrence for binary outcomes, and acute hepatitis B counts. Each case has downloadable data, map components, and accompanying instructions.
The healthy life expectancy example covers 177 map units over 2000–2020. It follows the process from importing the panel and checking its order to configuring a model, interpreting coefficients and contributions, and exporting results. The guide distinguishes historical example figures from newly reproduced analyses and explains how to read uncertainty and prediction outputs.
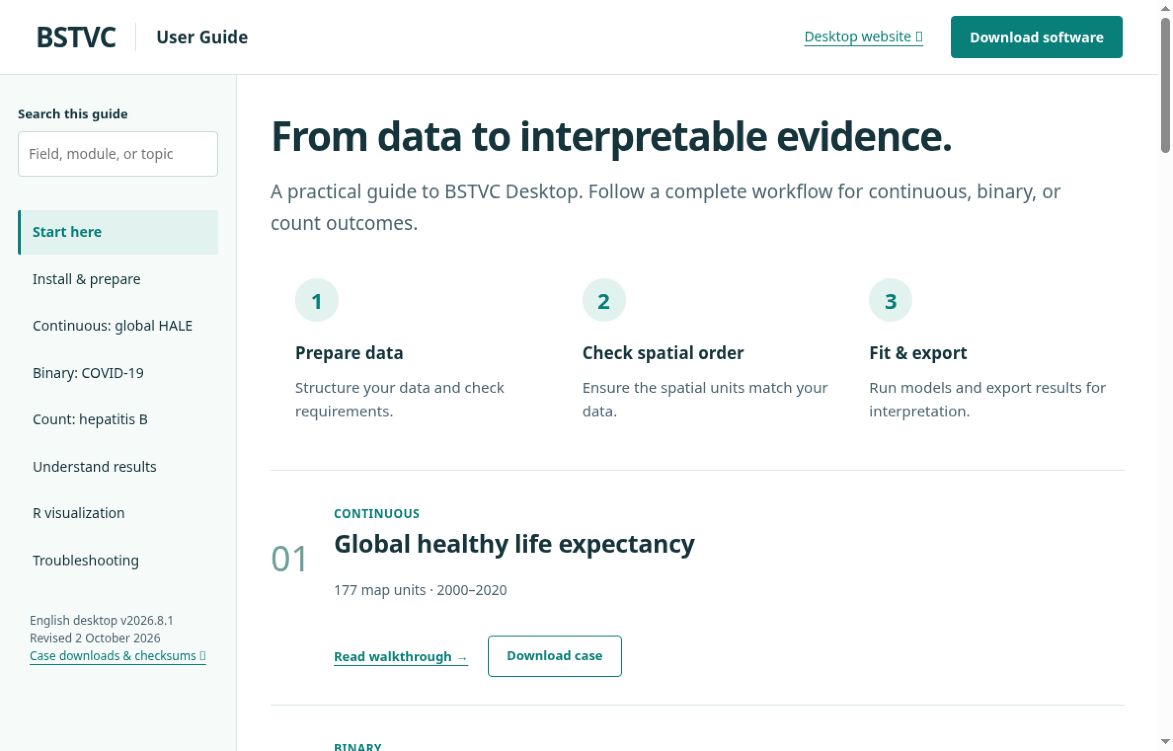
Figure 4. The English guide connects preparation, spatial-order checks, fitting, and export, with separate case walkthroughs. Live website capture, 5 October 2026.
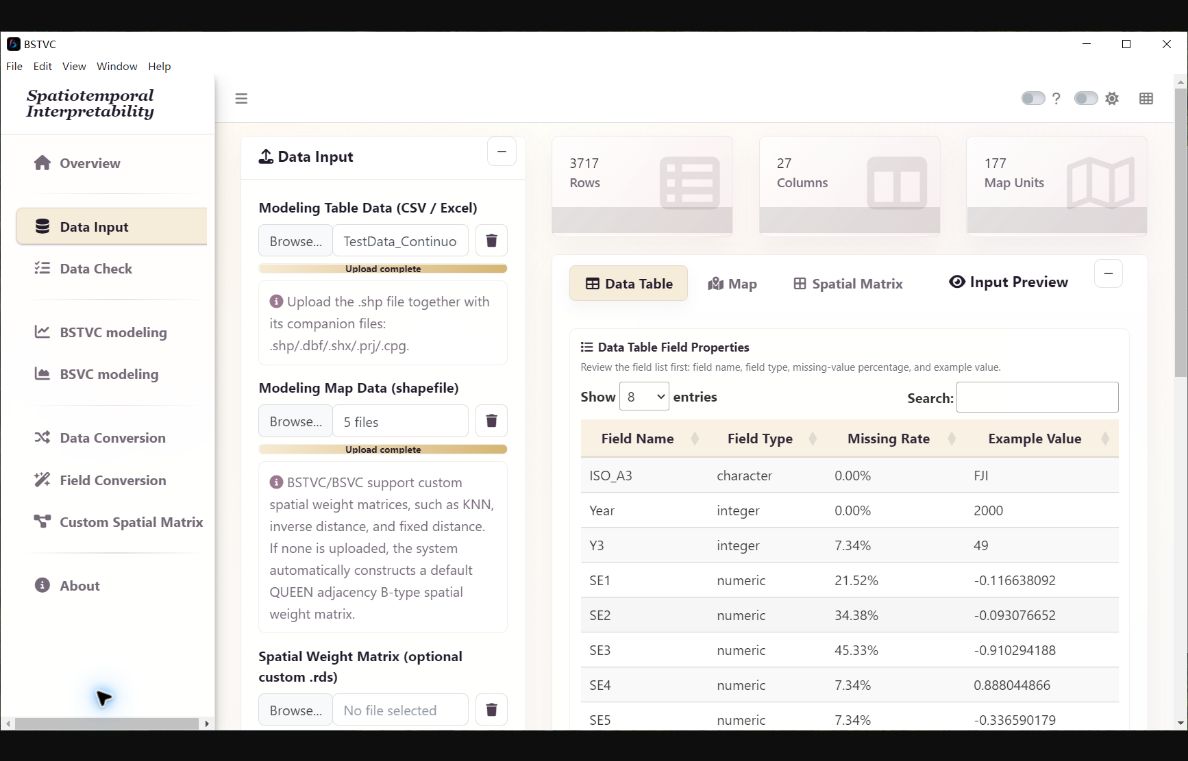
Figure 5. The original Desktop input illustration supplied by the official site shows the HALE case's table and map overview. Captured from the published image on 5 October 2026; this documents the guide's example, not a new model run.
Explore the BSTVC ecosystem
Alongside Desktop, BSTVC-R supports scripted workflows, BSTVC-Shiny provides an interactive R-based interface, and BSTVC-Monitor helps inspect local computational resource use. The product directory explains the available routes and their requirements.
Start with the official research website for the broader picture, or open the English guide and follow one case from input to interpretation. Together, these resources provide a concrete entry point for studying how relationships change across places and through time.