
Section navigation is enabled for this long article; the full text remains continuous.
BSTVC and Spatiotemporal Interpretability · Part 3
In Part 2, we asked what a shared regression coefficient can conceal. Here is a different question: if neighboring districts have similar health outcomes, must the exposure–outcome relationship also be the same?
No. Similar outcomes and similar relationships are different properties. A useful analysis asks which property is being modeled before interpreting the map.
Two spatial questions
Spatial dependence concerns how values at different locations are related under a specified neighborhood or distance structure. Positive spatial autocorrelation means nearby values tend to be similar. In regression, we may instead investigate dependence remaining after the included predictors have been considered. A clustered outcome map and clustered model residuals are not interchangeable evidence.
Coefficient heterogeneity concerns a relationship: whether the conditional association between a predictor and an outcome changes across places. Two districts can have similar outcome levels while different slopes describe how the outcome relates to a predictor. Conversely, different baseline levels can coexist with the same slope.
The original STVC methodological paper explicitly distinguishes spatial dependence from spatial nonstationarity in variable relationships. This distinction motivates separate questions about the spatial structure and the coefficients, rather than assuming that one automatically answers the other. Song, Shi & Wang, 2020
A small constructed example
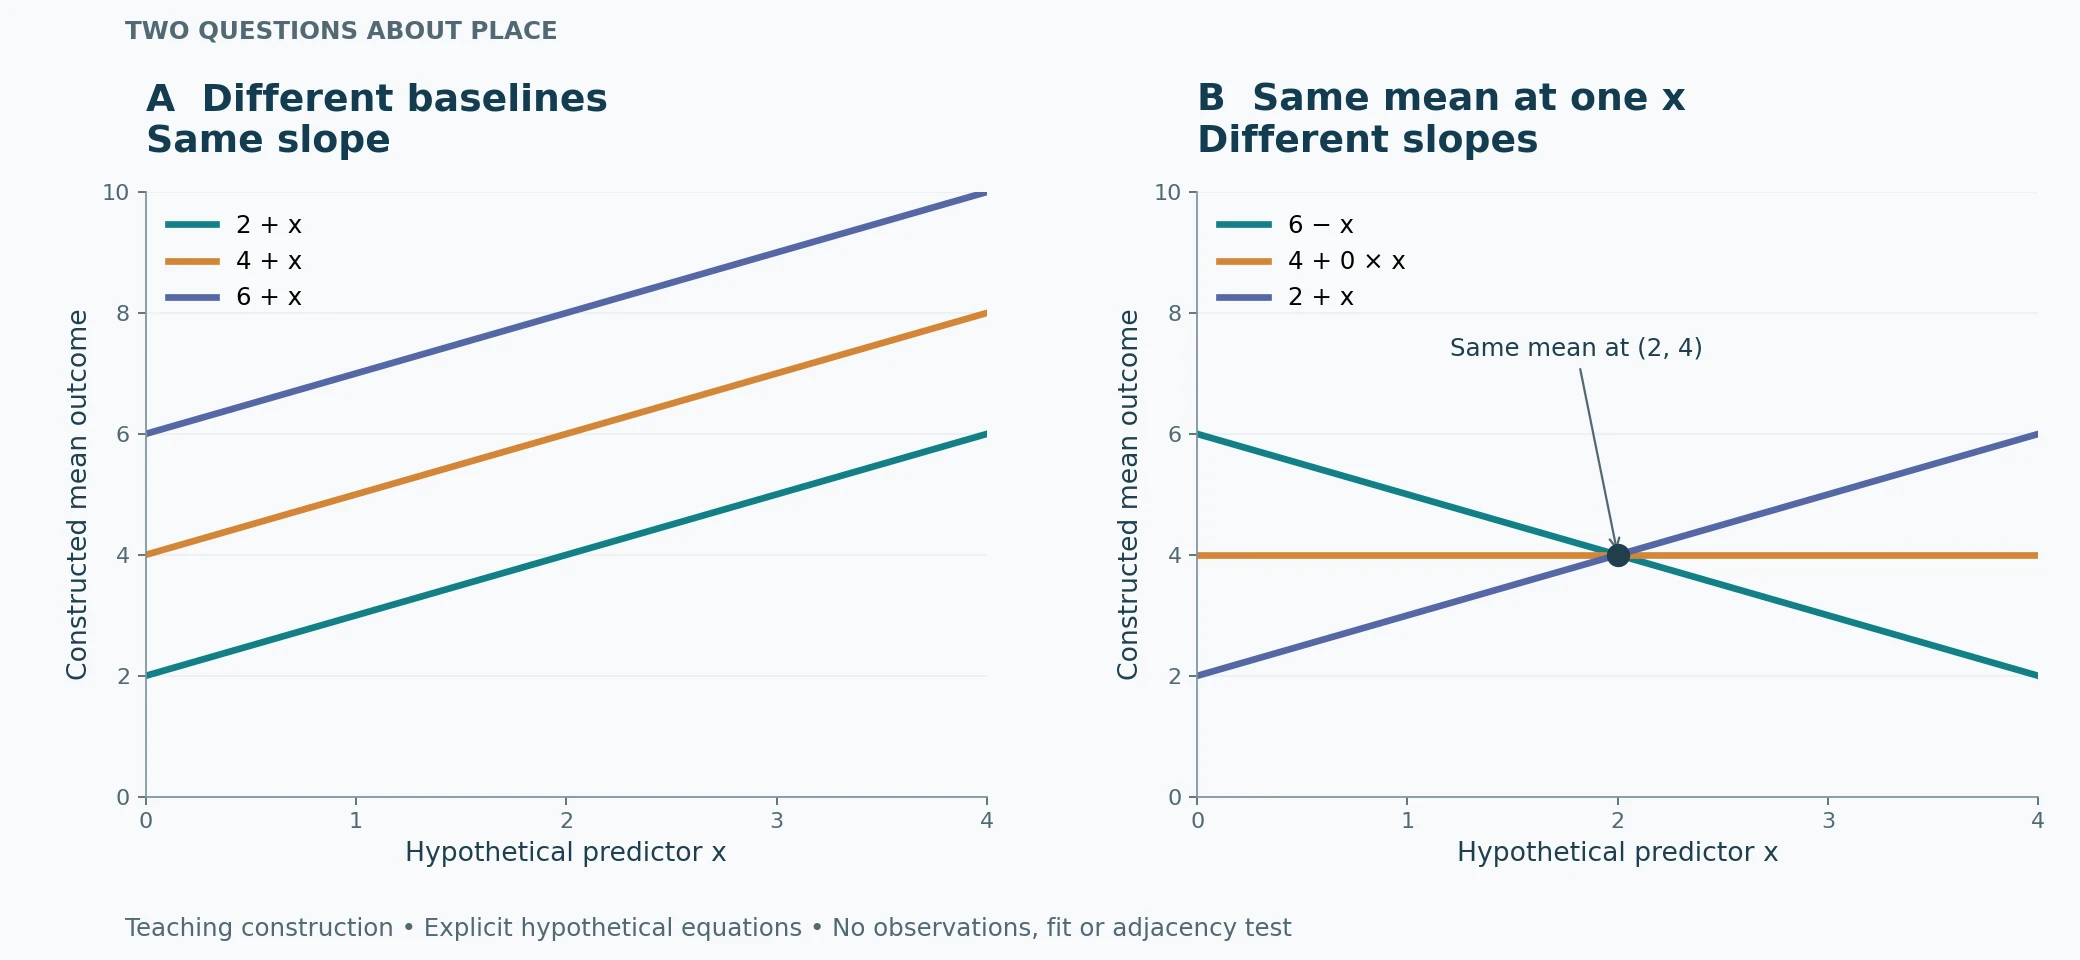
Figure 1. Teaching construction, not fitted results. Each line represents a hypothetical district, with an arbitrary predictor x from 0 to 4. In panel A, mean outcomes are 2 + x, 4 + x, and 6 + x: different baselines, the same slope of 1. In panel B, they are 6 − x, 4 + 0 × x, and 2 + x: different slopes, all meeting at x = 2 and mean outcome = 4. The values are chosen for explanation; there are no observations, estimated uncertainties, actual districts, or geographic adjacency tests in this figure.
Compare changes along each line in panel A: increasing x by one unit increases each constructed mean by one unit. Read panel B at x = 2: identical mean outcomes tell us nothing about whether the three slopes agree. These are simple linear examples. In a nonlinear model, coefficients live on the chosen link scale, so outcome-scale changes require additional interpretation.
What a spatial random intercept does
Consider the schematic linear predictor η(i) = α + u(i) + β × x(i). A spatially structured u(i) allows baseline levels to vary with a specified dependence structure; β remains a shared slope. A Besag prior, for example, links latent spatial effects through a neighborhood graph. Its definition concerns the latent effects, not a rule requiring neighboring observed outcomes to be equal. Official R-INLA Besag documentation
To let the slope vary, a model must include that variation, for example η(i) = α + u(i) + [β + v(i)] × x(i). Here v(i) changes the coefficient attached to x. These expressions are conceptual illustrations, not executable BSTVC specifications. Spatial priors can be used for intercepts or coefficients; the role depends on where the term enters the model. The spBayes SVC methods paper likewise distinguishes spatially varying intercept models from models allowing other design-matrix coefficients to vary. Finley & Banerjee, 2020
A practical reading sequence
- Name the object. Is the map showing an observed outcome, a fitted mean, a residual, or a coefficient? Each answers a different question.
- State the conditioning. Which other variables and time terms were included? A conditional association depends on that specification.
- Inspect the evidence. Check predictor coverage, collinearity, local uncertainty, and sensitivity to reasonable spatial structures and priors. Different colors alone do not establish a meaningful coefficient difference.
- Match the comparison to the aim. Use a shared-slope baseline and a scientifically motivated varying-coefficient alternative. Evaluate predictive claims with a validation design suited to the target places and times; added complexity is not automatically better.
For BSTVC, the useful progression is from a clearly defined research question to the relevant output: local coefficient interpretation, contribution assessment, or prediction. A map of clustered health outcomes is not, by itself, evidence of spatially varying exposure associations. Nor does an area-level association establish an individual-level or causal effect.
中文摘要
相邻地区的健康结局相似,不等于影响因素与结局的关联也相同。空间依赖关注不同地点的值之间如何关联;系数异质性关注同一变量的条件关联是否随地点变化。空间随机截距可以描述基线差异,但不会自动把共享斜率变成局部斜率。本文用人为设定的直线解释两者区别,不是真实研究结果,也没有拟合模型。阅读 BSTVC 图表时,先分清画的是结局、残差还是系数,再看不确定性、数据支持与验证;关联不能直接写成因果。
Next step: Take one map from your current analysis and complete the sentence: “This map shows ___, conditional on ___; it does not yet establish ___.”
Software, sources and credits
Start with the BSTVC organization website, BSTVC Desktop, and the BSTVC-R project. The software is developed by the BSTVC team, the HEOA–West China Health and Medical Geography Research Group, and collaborators. Current use is free for academic and other noncommercial purposes; the applicable official license governs each version.
- Song, C., Shi, X., & Wang, J. (2020). Spatiotemporally Varying Coefficients (STVC) model: a Bayesian local regression to detect spatial and temporal nonstationarity in variables relationships. Annals of GIS, 26(3), 277–291. Original paper.
- Finley, A. O., & Banerjee, S. (2020). Bayesian spatially varying coefficient models in the spBayes R package. Environmental Modelling & Software, 125, 104608. Original paper; author preprint.
- R-INLA. Besag model for spatial effects, official model documentation.
Series introduction · Previous article
Educational article by Chao Song and the BSTVC team. Figure created for this article from explicit hypothetical equations. No new empirical analysis or software fitting was performed. Sources checked 26 October 2026.