
Section navigation is enabled for this long article; the full text remains continuous.
BSTVC & Spatiotemporal Interpretability · Part 10 · Chao Song · 2 November 2026
A contribution percentage, a Bayesian R² and a prediction score can all describe one model—and still answer three different questions. Treating them as interchangeable makes a convincing-looking result say more than the evidence supports.
1. STVPI: how are the stated component scales allocated?
In the 2024 hospital-bed study, Equation (6) defines a factor's STVPI share using its spatial and temporal component standard deviations, divided by the summed factor scales plus a residual scale.
That is a specified component-scale index. State the exact formula, included components and denominator. It is not automatically a percentage of observed-outcome variance, and it is not a causal attribution. As Part 9 showed, changing the denominator changes the statement even when the model stays the same.
2. Bayesian R²: how much modelled variation lies in the predictive means?
Gelman, Goodrich, Gabry and Vehtari (2019) define a Bayesian R² using the variance of modelled predictive means and the modelled residual variance. For posterior draw s, write:
R²ₛ = Vμ,ₛ / (Vμ,ₛ + Vres,ₛ).
Vμ,ₛ is the variance across observations of their modelled predictive means at that draw. Vres,ₛ is the corresponding modelled residual variance. For Gaussian regression with constant residual variance, Vres,ₛ is σ²ₛ. Other likelihoods require their appropriate residual-variance definition; do not substitute a latent-scale quantity without explanation.
The posterior draws yield a distribution of R², not just one number. Report its summary and uncertainty, the outcome scale, and what is included in the predictive mean. This is a model-based summary at the evaluated covariates—not proof of performance for unseen regions or future years.
3. Predictive performance: how well does the model predict data it did not fit?
Choose a validation design that matches the intended use. Predicting another observation in a known setting is not the same challenge as predicting a new region or a later year. Keep preprocessing and model selection inside the training process where needed to avoid leakage.
Report the held-out target, split, metric and uncertainty. A count prediction error, probability calibration check and expected log predictive density are different quantities, not interchangeable “accuracy percentages.” LOO cross-validation estimates out-of-sample predictive performance; its practical approximation and diagnostics also need checking. A spatial or temporal application may require structured rather than ordinary observation-level splits.
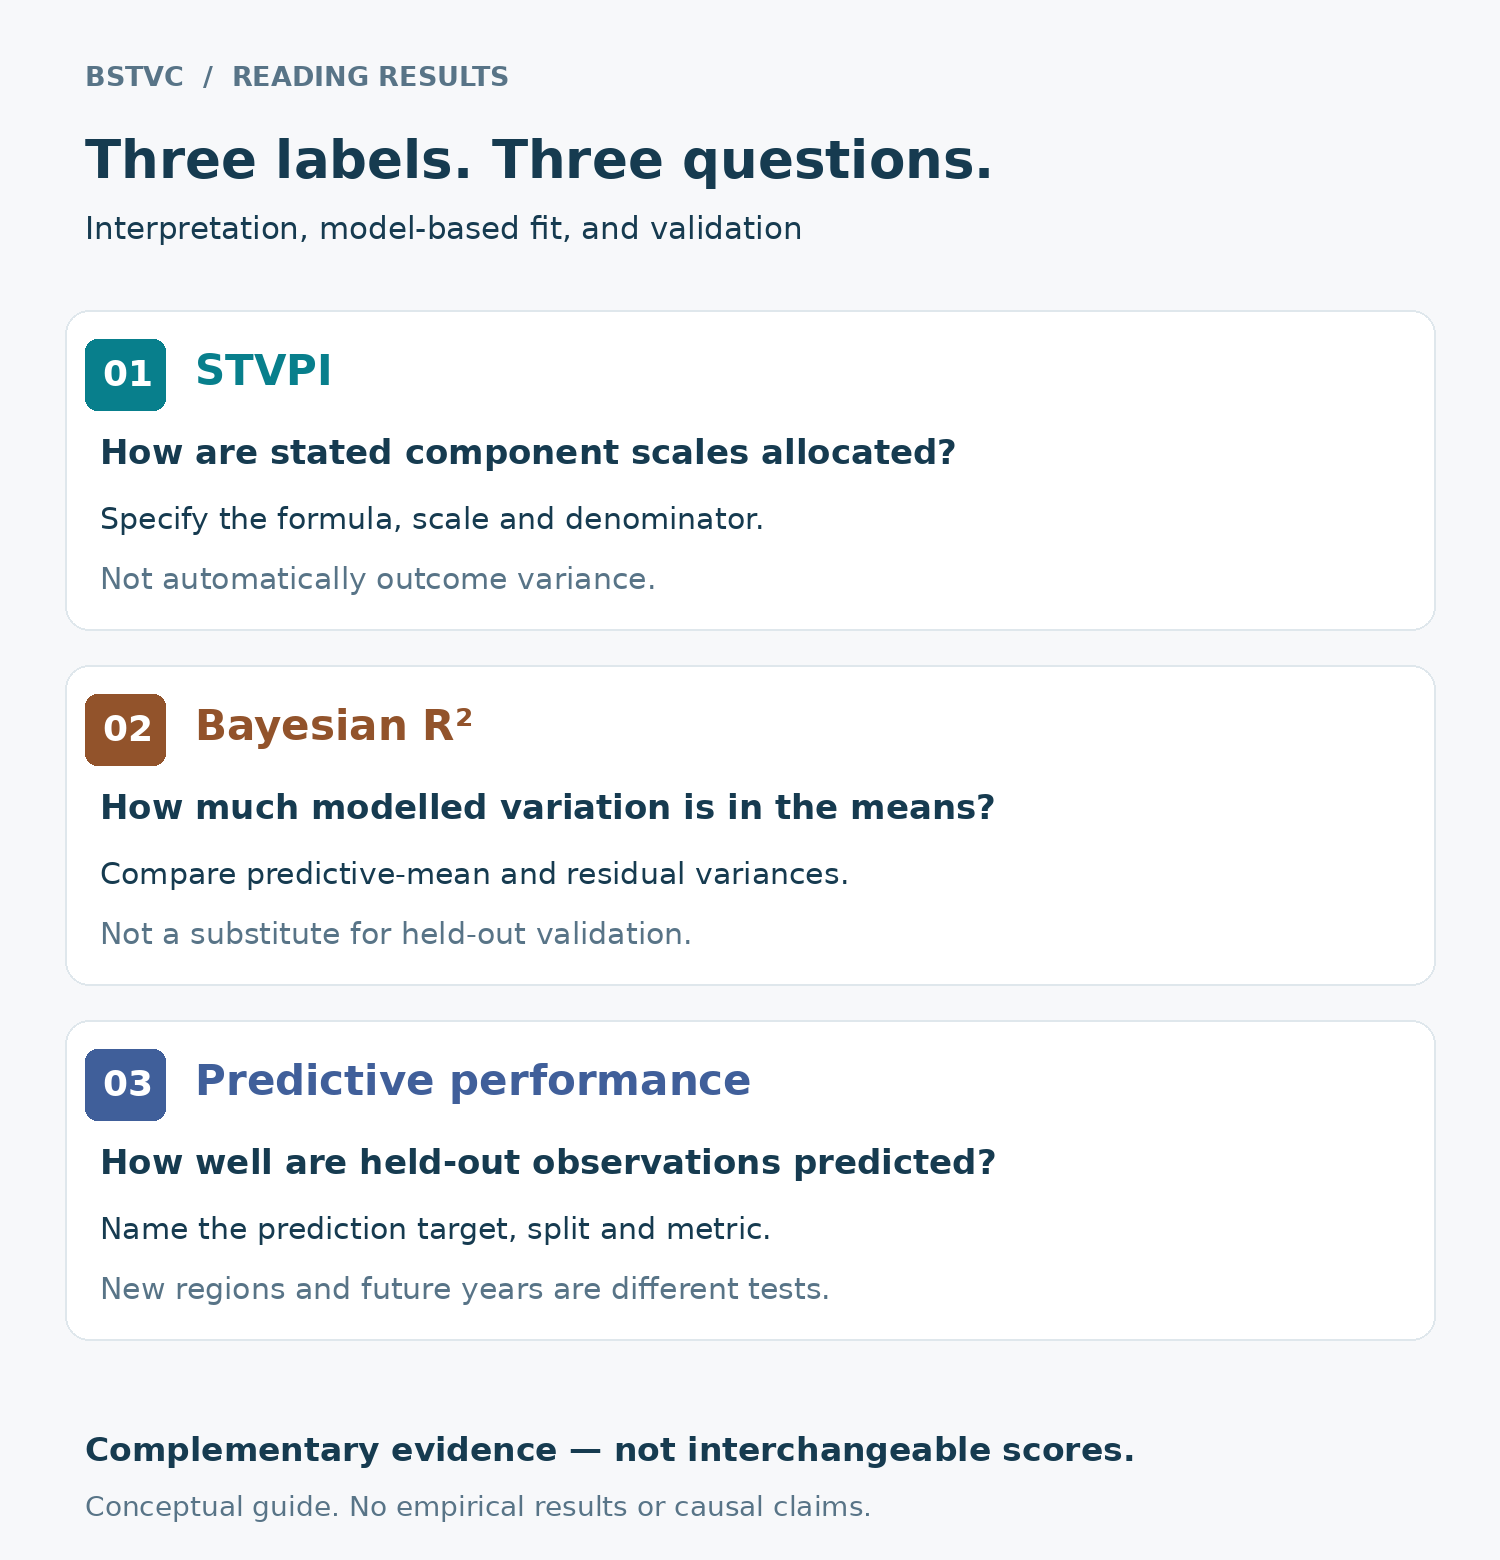
Figure 1. Conceptual guide, not empirical results. STVPI summarizes stated component scales; Bayesian R² compares predictive-mean and residual variation under its definition; validation evaluates a specified prediction target. These are complementary checks, not three names for one score. Definitions and cautions are also given in the webpage text.
Before writing “the model explains 80%”
Ask three questions: 80% of which quantity? On which scale? Evaluated on which data? A residual-share complement from an SD-based index cannot simply be relabelled Bayesian R². A high fitted R² cannot stand in for held-out skill. None of these quantities, by itself, establishes causation.
For a health-geography report, give each result its own label: a component interpretation with its denominator, an R² summary with its definition, and a validation result with its prediction target. If validation has not been performed, say so rather than borrowing confidence from a contribution chart.
中文速读
STVPI 回答既定组成尺度怎样分配;贝叶斯 R² 按特定定义比较预测均值的变异与模型残差变异;验证则检验特定未参与拟合数据上的预测表现。三者互补,但不能互换。报告“80%”前先说清分母、尺度和评估数据;高拟合度不等于能预测新地区或未来,也不代表因果解释。
Read, verify and use
This series credits the BSTVC team and the original research authors. Explore the BSTVC research programme and BSTVC Desktop. Academic and noncommercial use is free within the applicable licence; third-party terms also apply. Check the current Desktop notice before planning installation. This article explains reporting principles, not a verified software implementation or an available installer.
Primary reading: Song et al. (2024), BMC Public Health 24:423, Equation (6); Gelman et al. (2019), R-squared for Bayesian regression models, author manuscript; Vehtari, Gelman and Gabry (2017), Practical Bayesian model evaluation using leave-one-out cross-validation and WAIC, original paper.
Continue the series: Part 9: the residual and denominator · Part 8: variance and SD shares · Series introduction.