
Section navigation is enabled for this long article; the full text remains continuous.
BSTVC & Spatiotemporal Interpretability · Part 8 · Chao Song · 31 October 2026
A component can receive 50% under one contribution formula and 64.3% under another, without any new data or refitting. The difference may be a square. Before interpreting a percentage, check whether its denominator adds standard deviations or variances.
Read the formula, not only the name
In the published hospital-bed application, STVPI Equation (6) adds the spatial and temporal component standard deviations for each factor, and retains the residual standard deviation in the denominator:
ρₖ = 100 × (σμₖ + σγₖ) / [Σⱼ(σμⱼ + σγⱼ) + σε].
Thus, “variance partitioning” in the index's name does not mean this particular equation sums squared scales. The original paper explicitly describes its component scales. Preserve that definition when reproducing the study; a variance-based alternative is a different calculation.
One set of components, two summaries
Consider three invented component standard deviations, on a common model scale: A = 1, B = 2, residual = 3. They are teaching inputs, not estimates from a fitted BSTVC model.
For an SD-normalized summary, divide each value by 1 + 2 + 3 = 6. The shares are 16.7%, 33.3% and 50.0%.
For a squared-scale summary, square each component first, then divide by 1² + 2² + 3² = 14. The shares become 7.1%, 28.6% and 64.3%.
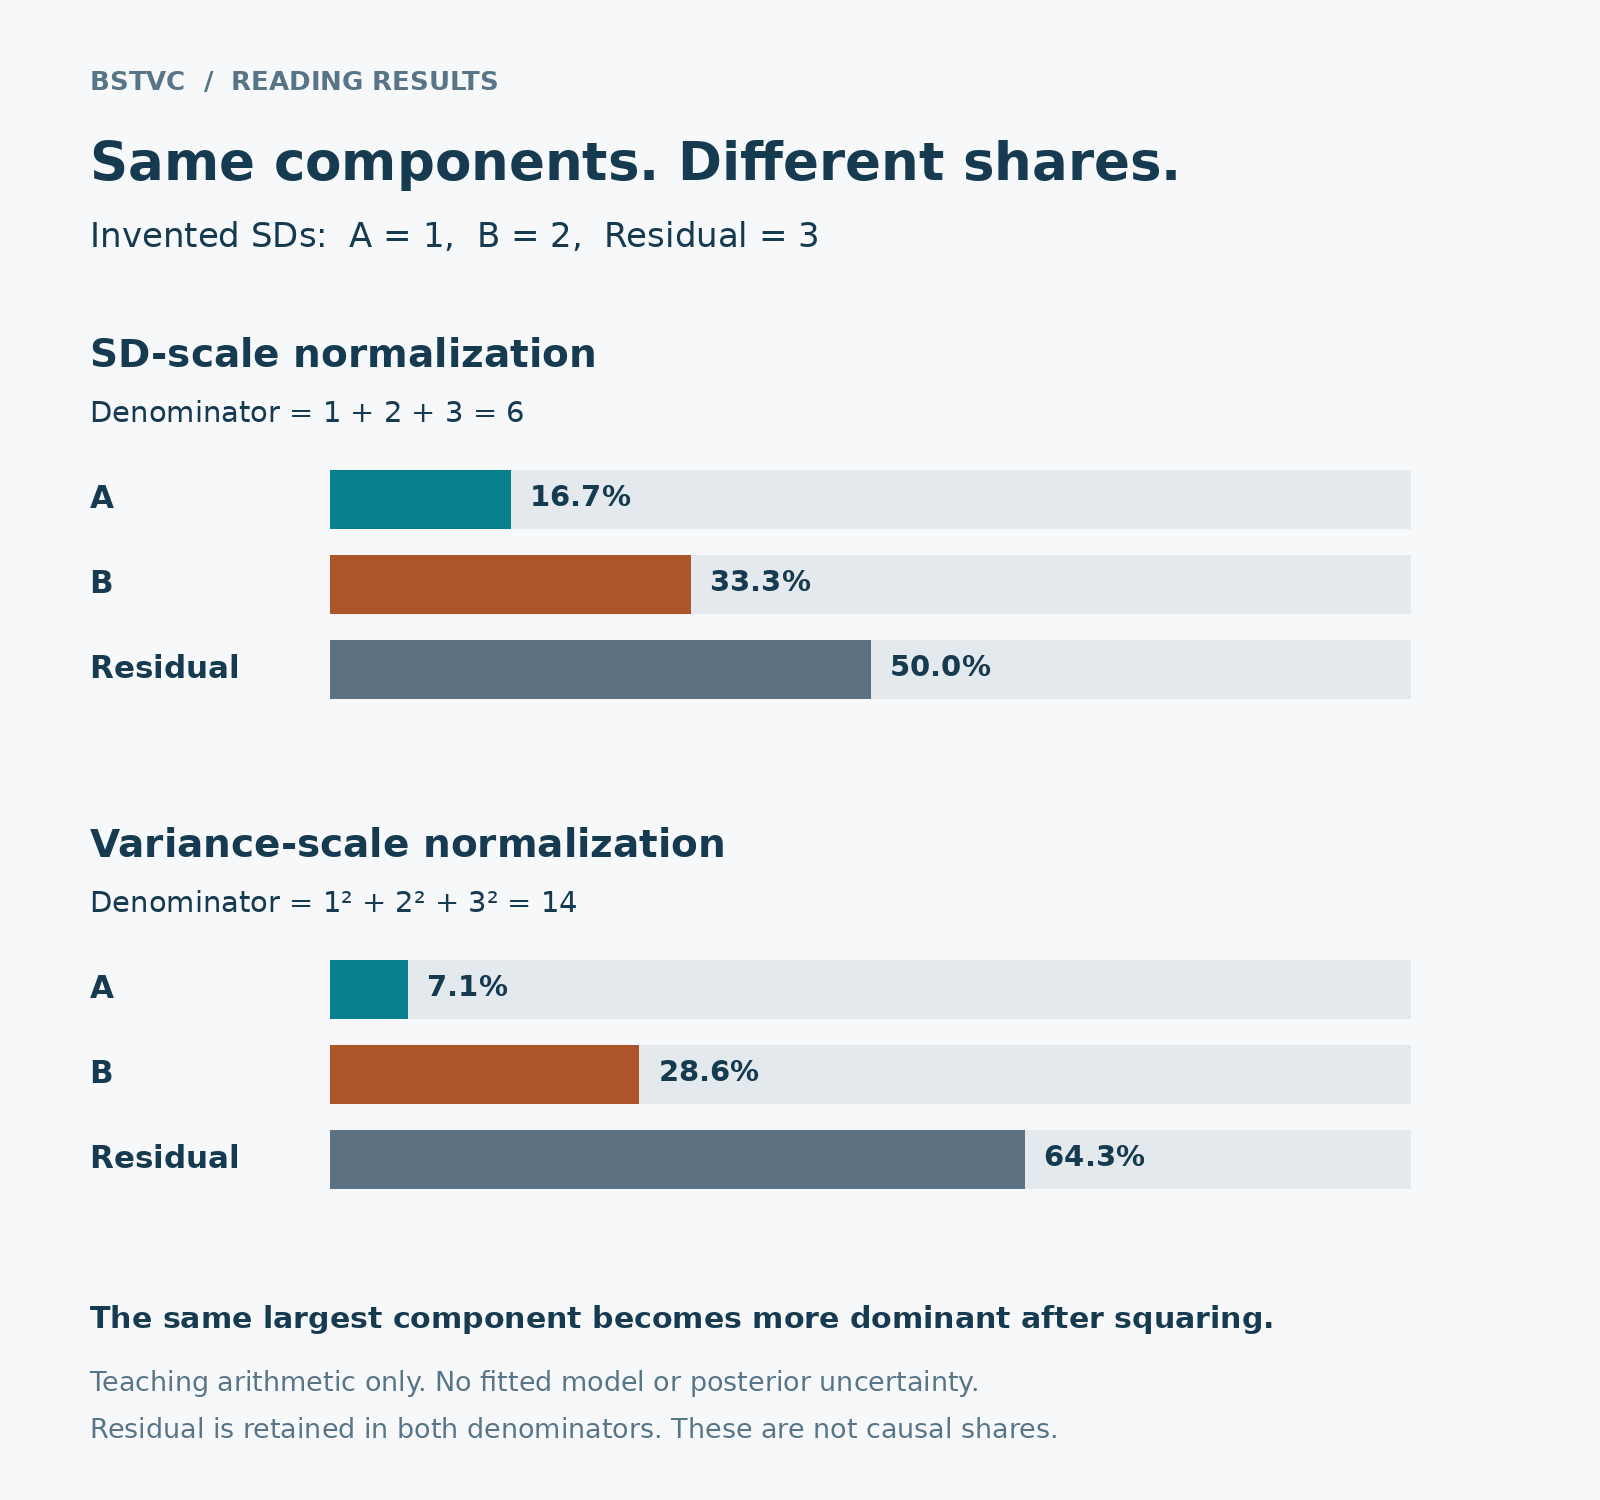
Figure 1. Arithmetic teaching example. The component set and residual are identical in both calculations. Only the transformation changes. Percentages are rounded to one decimal place; no real data, posterior uncertainty or software output is represented.
For nonnegative component SDs sⱼ with a positive total, the two definitions are:
SD share: 100 × sⱼ / Σₗsₗ.
Squared-scale share: 100 × sⱼ² / Σₗsₗ².
The second formula gives larger components more weight relative to smaller ones. Individual component rankings remain unchanged in this example, but the numerical shares and gaps change. Neither formula is automatically the better answer: the appropriate summary depends on the quantity defined in the study.
Keep grouping and uncertainty explicit
If a factor combines spatial and temporal components, say when the grouping happens. In general, a² + b² differs from (a + b)². Squaring an already combined SD sum does not reproduce the sum of its component variances.
The same care applies to posterior summaries. Transforming a posterior mean is generally different from transforming each draw and then averaging. For an uncertainty-aware index, report how the shares and intervals were calculated, rather than attaching unexplained percentages to a model output table.
What the percentages do not establish
A normalized collection of component variances is not automatically a decomposition of observed-outcome variance. For additive random quantities, the variance of their sum includes covariance terms. A nonlinear link also separates the linear-predictor scale from the outcome scale. Components must be defined and made meaningfully comparable before normalization.
Neither set of shares above is a causal attribution or a held-out prediction score. In a health-geography report, “64.3% under the stated squared-scale convention” is defensible for this teaching calculation; “64.3% of hospital-bed differences caused by this component” is not.
Before reporting a share: name the formula, component set, residual treatment, grouping rule, model scale and uncertainty calculation. Do not compare percentages across papers until those choices match.
中文速读
同样的标准差 1、2、3,直接归一化得到 16.7%、33.3%、50.0%;先平方再归一化则是 7.1%、28.6%、64.3%。数据没变,指标定义变了。公开 STVPI 论文的上述公式使用标准差尺度;这里的平方版本仅作教学对照,不代表所有软件版本都提供两种算法,也不能当成因果贡献或预测准确率。
Read, verify and try
This series credits the BSTVC team and the authors of the underlying research. Start with the BSTVC research programme and BSTVC Desktop. The Desktop offering is free for academic and noncommercial use within its applicable licence; consult the current licence and third-party terms before reuse. This article does not assert that every release implements both summaries.
Installer status checked 31 October 2026: the English Desktop page says the v2026.8.1 Windows installer has been withdrawn because of a bug and V2 will be provided later. Check the current installer notice before downloading.
Source: Song C, Fang L, Xie M, et al. (2024). Revealing spatiotemporal inequalities, hotspots, and determinants in healthcare resource distribution: insights from hospital beds panel data in 2308 Chinese counties. BMC Public Health, 24, 423. Published 9 February 2024. Open-access original, Methods, Equation (6).
Series links: Part 7: coefficient magnitude versus contribution · Part 5: posterior uncertainty · Series introduction.