
Section navigation is enabled for this long article; the full text remains continuous.
BSTVC & Spatiotemporal Interpretability · Part 7 · Chao Song · 30 October 2026
A striking coefficient on a map can be scientifically interesting. Before calling it the “most important factor,” ask what importance means: a local association, a component's relative variability, or improved prediction? These questions require different evidence.
Start with the quantity on the map
In a regression with a linear predictor, a coefficient describes the change in that predictor associated with a one-unit covariate change, holding the other model terms fixed. Its interpretation depends on the link function and units. In BSTVC, a coefficient can vary across space and time, subject to the chosen model structure.
A coefficient map therefore helps answer where and when an association is stronger, weaker or changes sign. Read its posterior uncertainty alongside its magnitude. A positive coefficient alone does not establish a causal effect, and a large estimate with a wide interval deserves different wording from a precise one.
Size and variation are different properties
Consider two invented coefficient profiles, measured on the same scale. Profile A has values 4.9, 5.0 and 5.1. Profile B has values −1.0, 0.0 and 1.0. A is larger at every location, yet B varies more across locations. Their sample standard deviations are 0.1 and 1.0 respectively.
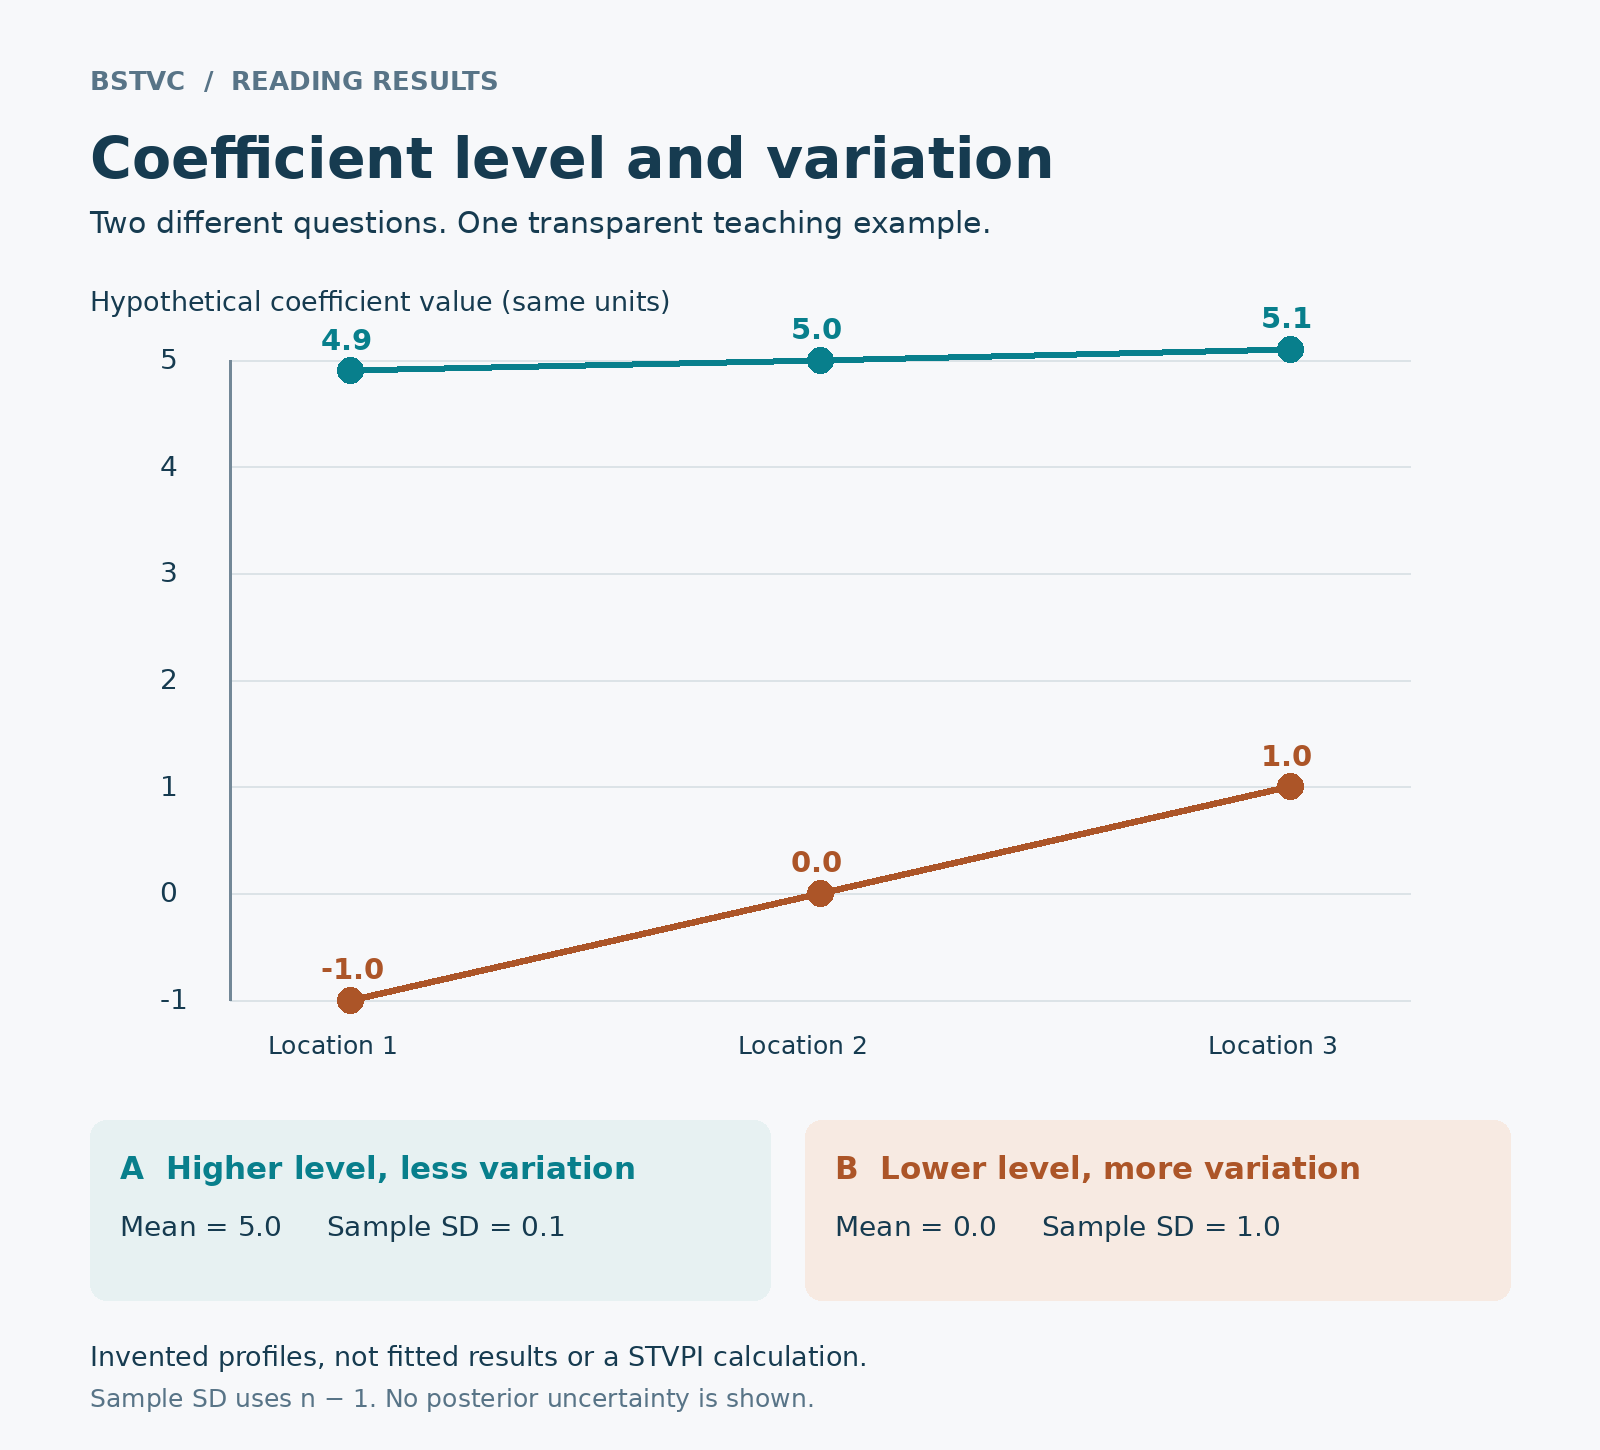
Figure 1. An arithmetic teaching example, not fitted BSTVC output. Both profiles use the same hypothetical coefficient units. Sample standard deviations use the n−1 denominator. No posterior uncertainty is represented. The example separates coefficient level from coefficient variation; these three-point sample SDs are not estimates of the latent scale parameters used in a fitted STVPI calculation.
A second distinction concerns covariate units. Expressing distance in metres instead of kilometres changes the numerical coefficient without changing the fitted relationship. Even with a common standardization, inspecting the single largest coefficient does not define a whole-model contribution measure.
What the published STVPI summarizes
The 2024 hospital-bed study reports local coefficient patterns separately from a spatiotemporal variance partitioning index (STVPI). Its Equation (6) uses spatial and temporal component standard deviations for each factor and includes a residual component in the denominator:
ρₖ = 100 × (σμₖ + σγₖ) / [Σⱼ(σμⱼ + σγⱼ) + σε].
Here σμₖ and σγₖ denote the factor's spatial and temporal component scales, and σε denotes the residual scale. This is the published standard-deviation-scale convention, despite “variance partitioning” in the name. It should not silently be replaced with a squared-scale formula. See Song and colleagues (2024), Methods, Equation (6).
Under that definition, a share compares specified model-component scales. It is not a ranking of the largest coloured pixels on a coefficient map. Report the actual formula, component set, model scale and covariate preprocessing so readers know what the percentage summarizes.
A contribution percentage needs a careful sentence
A useful results sentence separates the findings: “The estimated association was stronger in these locations, while the component-share summary was calculated across the specified model components.” Add uncertainty and name the index convention used.
Avoid converting such a percentage into “this factor caused this percentage of the outcome.” Observational associations do not supply that causal interpretation. Nor does a high component share demonstrate that the factor improves prediction for a new region or year. That requires validation matched to the prediction target.
For the same reason, correlated model components complicate intuitive attribution: the variance of their sum can include covariance terms. A normalized component-scale index should be reported on its own terms, rather than presented as an automatic additive decomposition of observed-outcome variance.
A short reporting checklist
- Local relationship: Which coefficient, units, link scale, locations and times? What uncertainty?
- Overall summary: Which components, SD or variance scale, denominator and residual treatment?
- Scientific claim: Association, model-based summary or held-out prediction? Is the evidence appropriate?
In plain language, the map describes the local relationship; the index provides a specific model-based summary. Neither replaces the other.
中文速读
局部系数绝对值较大,说明在给定单位和模型尺度下,某处的关联幅度较大;整体贡献指标则按特定公式汇总模型组件。上图只是教学算例:A 的系数更大,B 的地区间变化却更大,不能把图中的样本标准差当作 STVPI 的拟合参数。引用贡献比例时,应写清公式、尺度、分母与残差,并与因果解释及预测表现分开。
Read, verify and try
This series is developed within the BSTVC research programme, with credit to the BSTVC team and the authors of the cited studies. Explore BSTVC Desktop and its user guide. The Desktop offering is for academic and noncommercial use under its applicable licence; check the current licence and third-party terms before reuse. This article does not claim that every software release implements the same contribution convention.
Source: Song C, Fang L, Xie M, et al. (2024). Revealing spatiotemporal inequalities, hotspots, and determinants in healthcare resource distribution: insights from hospital beds panel data in 2308 Chinese counties. BMC Public Health, 24, 423. Original open-access paper. The article cites the 2022 population-ageing STVPI study; the formula discussed here was verified directly in the 2024 paper.
Continue the series: Part 5: coefficient maps and uncertainty · Part 6: choosing between BSTVC, GWR and GTWR · Series introduction.